
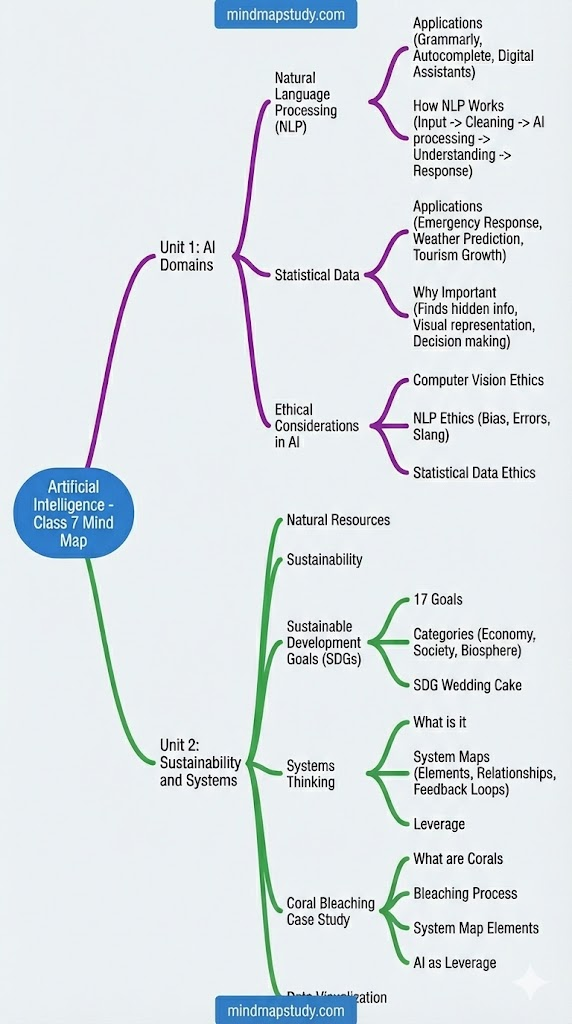
Unit 1: AI and Other Technologies – Domains of AI
Word Scramble Solutions
Let’s unscramble the phrases to discover the domains of artificial intelligence:
- TERPUCOM SIONVI → COMPUTER VISION
- TADA ENCESCI → DATA SCIENCE
- TURALNA GUAGELAN CESSPROING → NATURAL LANGUAGE PROCESSING
Session 1: Domains of AI and NLP
Understanding Natural Language Processing
Natural Language Processing (NLP) enables machines to understand language just as human beings do. Computers and robots use NLP to process real-world language, whether spoken or written, and make sense of it.
How We Speak Activity – Contextual Answers:
Q1: How do we come up with an appropriate response when someone says “Thank you”?
- We understand the context and meaning of the words
- We recall social conventions and polite responses
- We choose an appropriate reply like “You’re welcome” or “My pleasure”
Q2: Can machines understand our language?
- Yes, through Natural Language Processing
- Machines can process text and speech data
- AI helps computers interpret human language patterns
Q3: Have you ever talked to a computer or robot?
- Digital assistants like Siri, Alexa, Google Assistant
- Chatbots on websites
- Voice-activated devices
How NLP Works
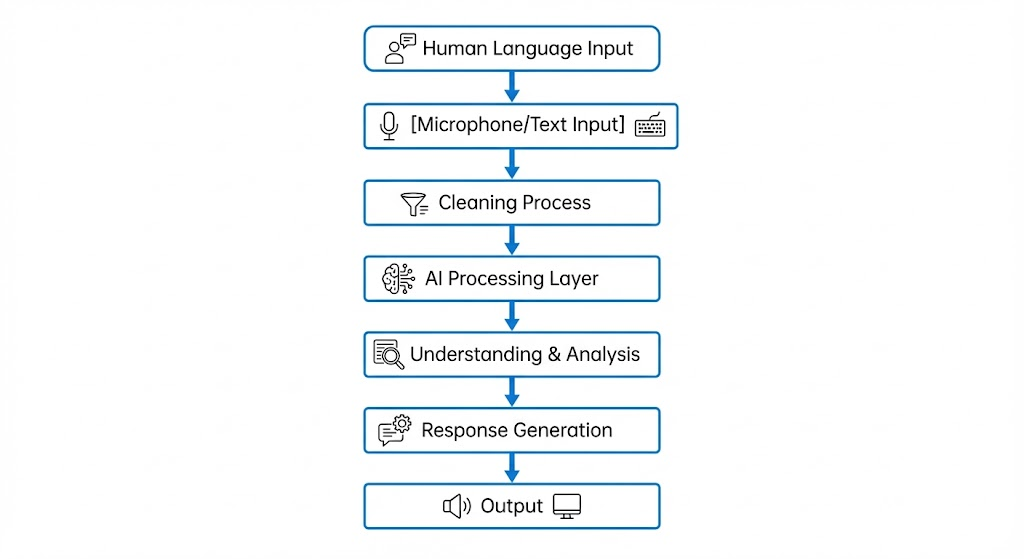
NLP processes human language to make sense of it in a way computers can understand. The input speech or text is cleaned to make it easier for computers to process. Computers use learning-based AI to analyze the input and generate appropriate responses.
Applications of NLP
Grammar and Spelling Correction
Applications like Grammarly use NLP to build typing assistants that review spellings, grammar, and punctuation. They search for replacements for identified errors and improve overall writing quality.
Autocomplete and Text Prediction
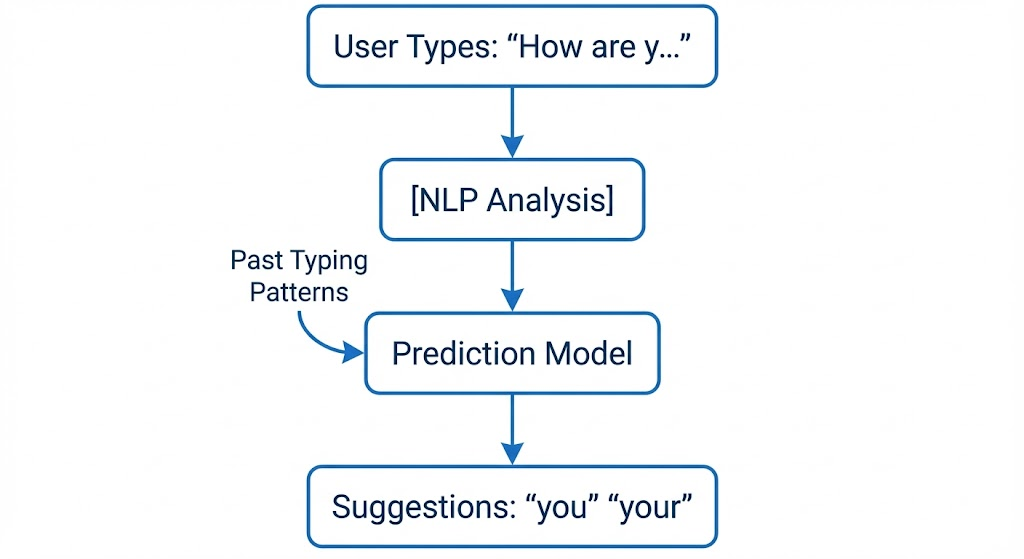
Autocomplete features use NLP to complete words you’re writing or predict the next word based on your typing habits.
Digital Assistants
Digital assistants like Apple’s Siri, Amazon’s Alexa, and Google Assistant understand human languages and answer questions based on your past activity and general knowledge.
Activity: Invitation Card Solutions
Purpose: Understanding how Grammar checker uses AI in editing
Steps to Create an Invitation:
- Visit writer.com/grammar-checker
- Write a 50-word invitation message for Environment Club inauguration
- AI detects spelling and grammatical errors in real-time
- Paste corrected message in invitation card
- Download completed card
What You Notice:
- Automatic error detection as you type
- Suggestions for better word choices
- Grammar corrections appear instantly
- AI improves sentence structure
Three More Grammar Checker Examples:
- Email writing for professional communication
- Essay and assignment checking for students
- Social media post refinement
Activity: Say What You See Solutions
Purpose: Experience how NLP works to generate images
Guidelines:
- Open experiments.withgoogle.com/say-what-you-see
- Launch Level 1
- Describe the displayed image using simple words
- AI provides feedback about object recognition
- Progress through different levels
Reflection Answers:
- AI Accuracy: AI identifies objects based on training data patterns
- Improving Communication: Use specific, clear descriptive words
- Learning: AI interprets visual information by matching descriptions to image features
Session 2: Statistical Data
Understanding Statistical Data
Statistical Data enables machines to understand large amounts of numerical data – age, prices, temperature, humidity, etc. Computers use Statistical Data to analyze numbers and generate meaningful information.
Activity Solutions – Class Questions:
Q1: How many students are there in your class?
- Count total students present
- This is numerical data collection
Q2: How many members are in your family?
- Count family members
- Numerical data about household size
Q3: Will you buy more candies or chocolates?
- Compare classmates vs family members
- Whichever number is larger determines the answer
Observation: Data helps make informed decisions based on quantities and comparisons.
Q1: Can machines understand numbers?
- Yes, through Statistical Data processing
- Machines excel at numerical analysis
Q2: Can machines analyze numbers to predict?
- Yes, AI uses historical data patterns
- Predictions based on statistical analysis
Why Statistical Data is Important
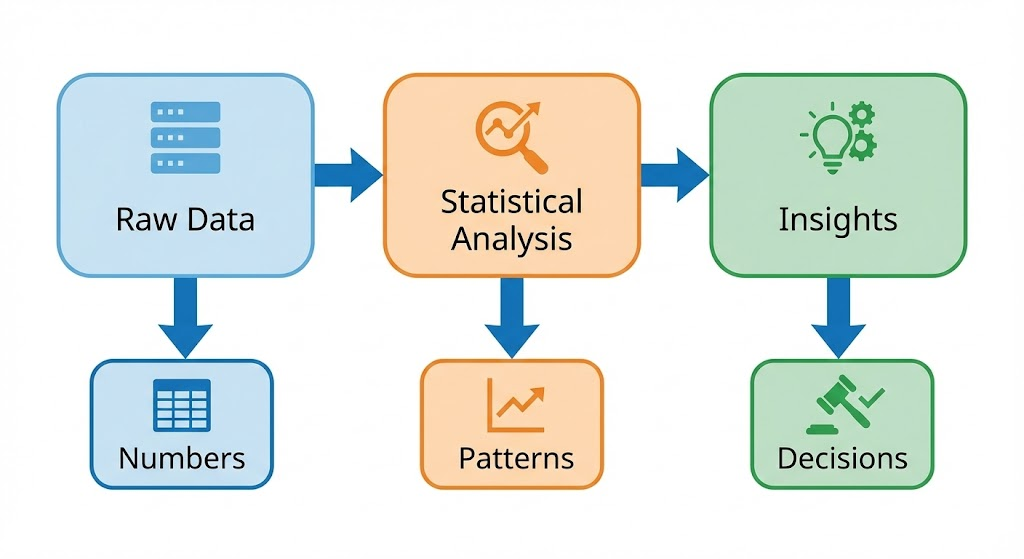
- Finds hidden and unexpected information
- Visual representation makes data easier to understand
- Analysis helps in making informed decisions
Applications of Statistical Data
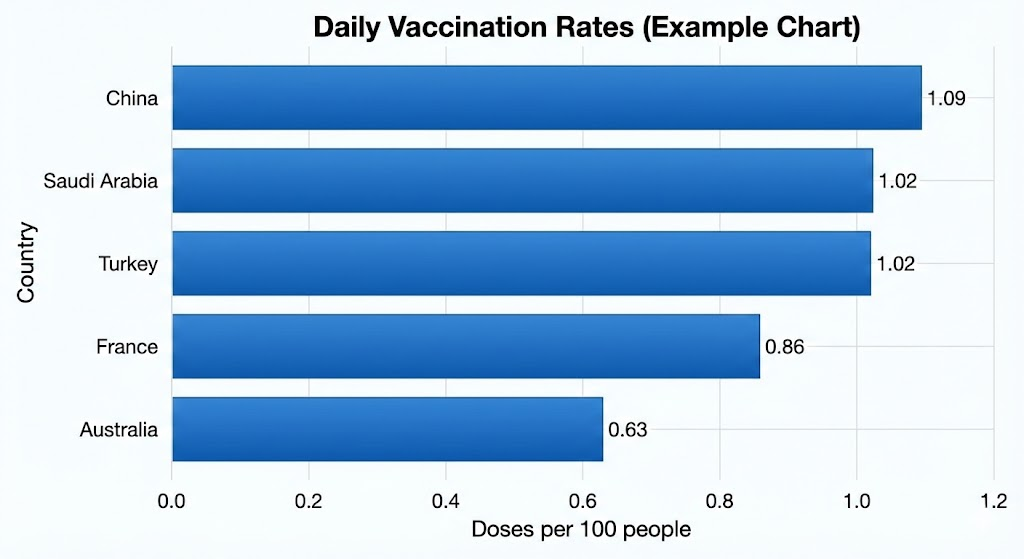
Emergency Response – COVID-19 Vaccination
Authorities used COVID-19 Statistical Data including:
- Number of cases per region
- Rate of spread
- Vaccination progress
This helped prepare healthcare systems and deliver vaccines effectively.
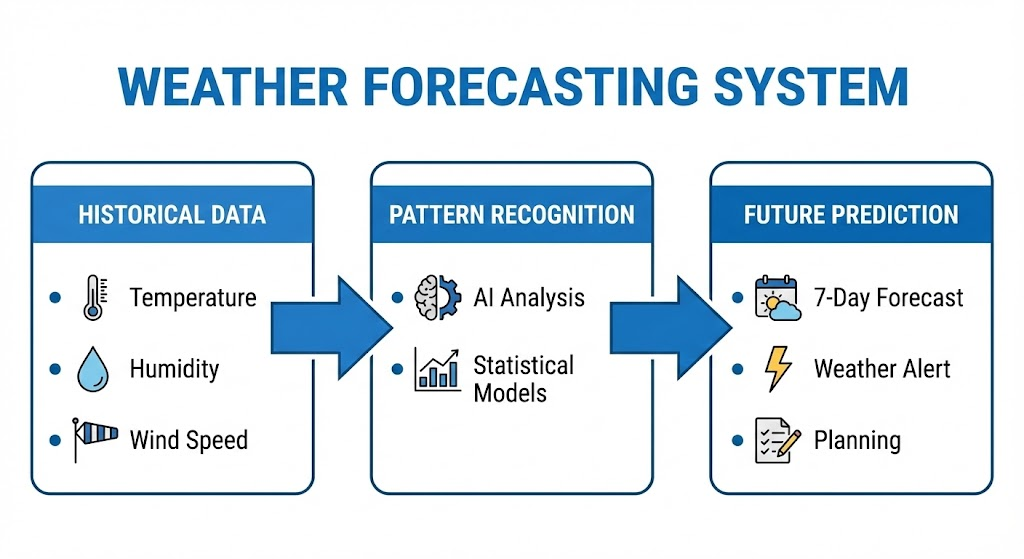
Weather Prediction
Statistical Data forecasts weather by analyzing:
- Wind speed
- Temperature
- Humidity
- Pressure levels
Ethical Considerations in AI Domains
Ethics in Computer Vision
Broad Strategies:
- Informed Consent: Participants fully informed about evaluation purpose and data usage
- Voluntary Participation: People participate freely without coercion
- Do No Harm: Avoid physical or psychological stress, anxiety, or privacy invasion
- Confidentiality: Identifying information not accessible to unauthorized persons
- Anonymity: Participant identity remains unknown to research team
- Relevant Assessment: Only assess components relevant to the program
Ethical Issues in Natural Language Processing
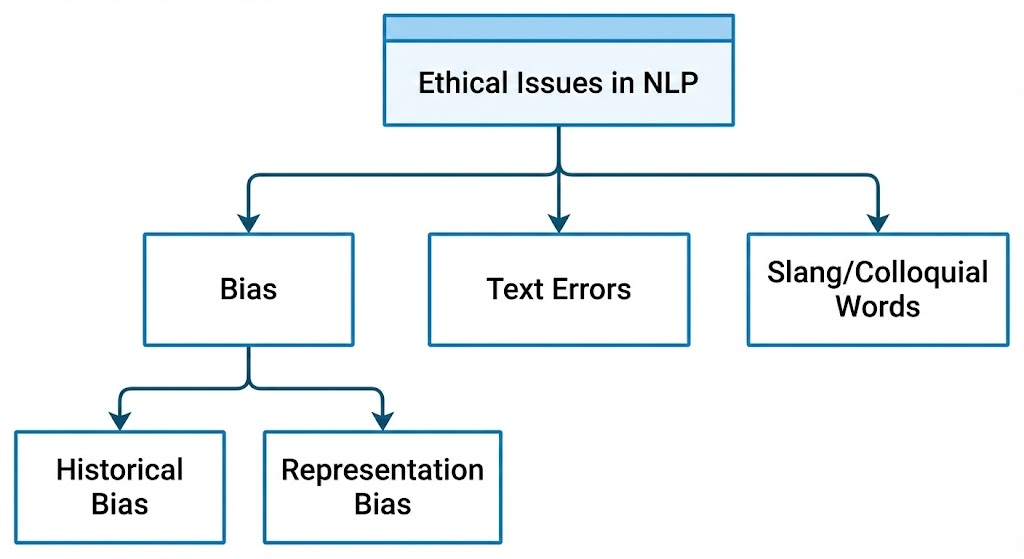
1. Bias:
- Historical Bias: Stereotypes reflected in machine interpretation (e.g., “nurse” associated with women)
- Representation Bias: Some populations over-represented or neglected in data
2. Errors in Text and Speech: Misspelled words and different accents reduce efficiency
3. Slang and Colloquial Words: New phrases form regularly, hard to track and define
Ethical Considerations for Statistical Data
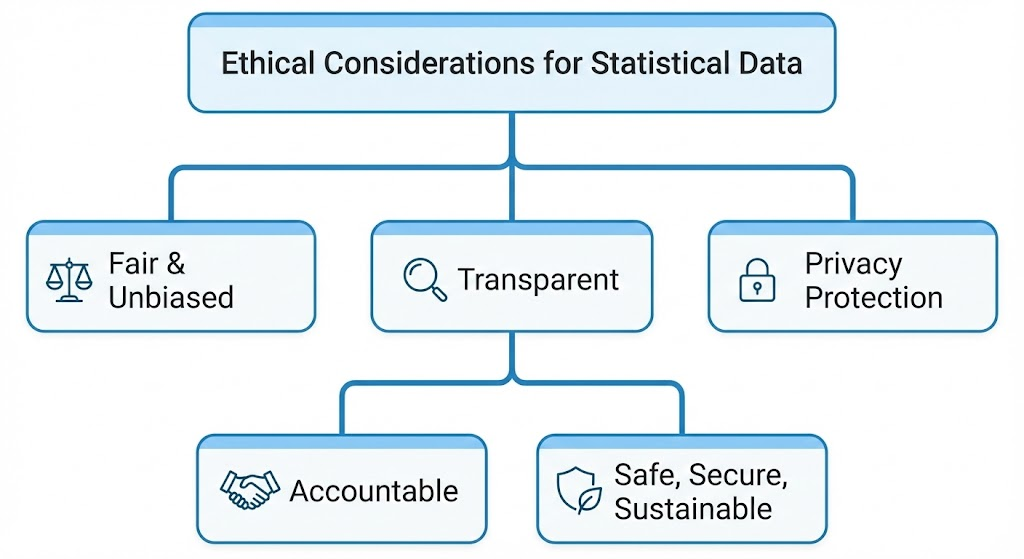
Five Principles:
- Fair and Unbiased: Test AI decisions for skewed results or biases
- Transparent, Explainable: Non-technical persons understand AI conclusions
- Privacy Protection: Respect user privacy, use minimum necessary information
- Accountable: Provide contact points, incorporate feedback
- Safe, Secure, Sustainable: Robust design defending against attacks
Activity: Birthday Month Solutions
Purpose: Collect data, represent visually, and analyze
Data Collection Steps:
- Open Microsoft Excel
- Create columns: Name | Birthday Month
- Collect data from at least 15 classmates
- Note responses in columns
Data Visualization Steps:
- Select both columns
- Click “Insert” tab
- Choose “Recommended Charts”
- Select appropriate chart type
Sample Result:
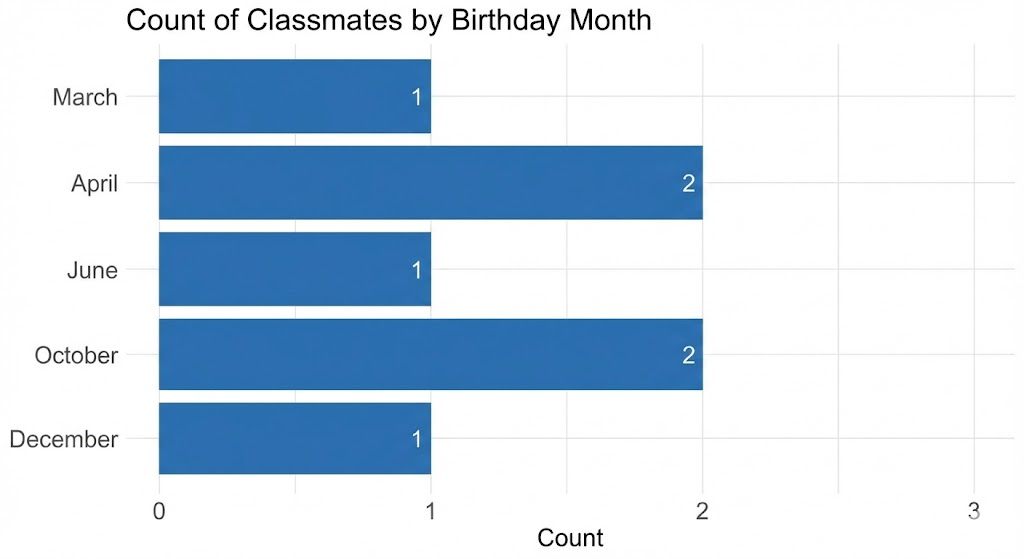
Interpretation:
- Easily see which months have common birthdays
- Helps teachers plan birthday celebrations
- Identifies patterns in class birthday distribution
Learning Outcomes:
- Accurate data collection and organization
- Using Excel to create appropriate graphs
- Interpreting graphs to identify trends
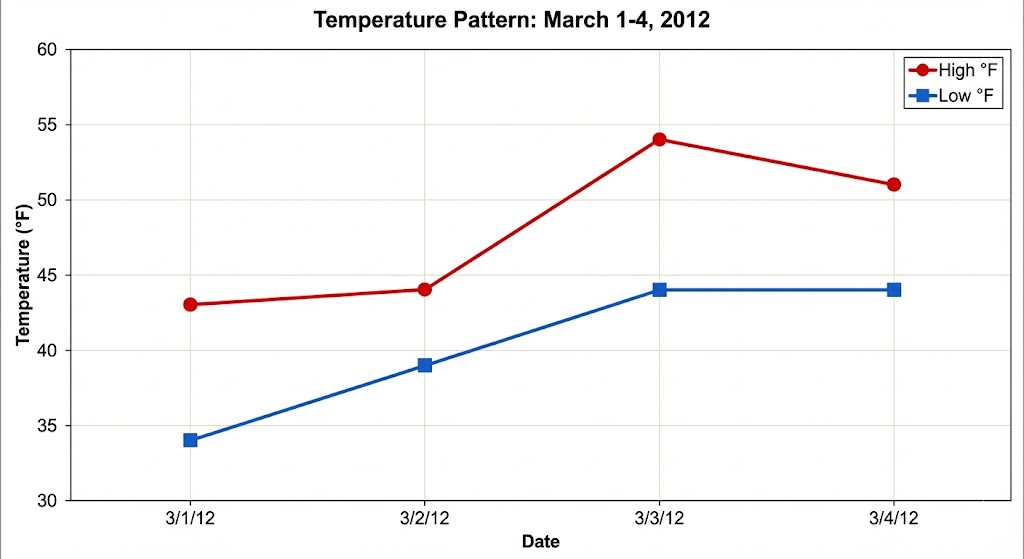
Real-Life Data Examples
Example 1: Seattle Temperature
Example 2: Fruit Sales
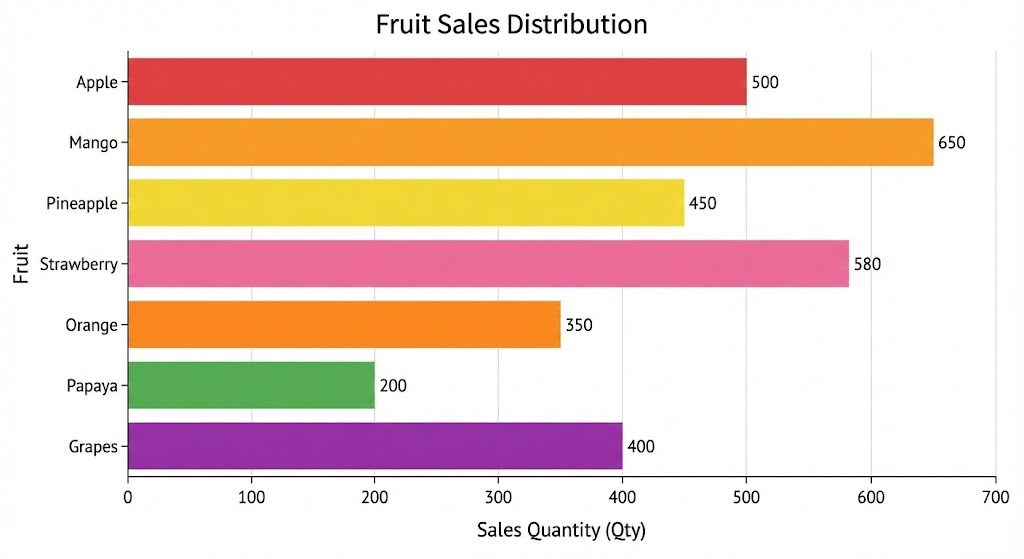
Analysis:
- Most sold: Mango (650)
- Least sold: Papaya (200)
Statistical Data helps visualize numerical information and make informed decisions.
Unit 2: Artificial Intelligence – Exploring Innovations and Societal Sustainability
Session 1: Sustainability
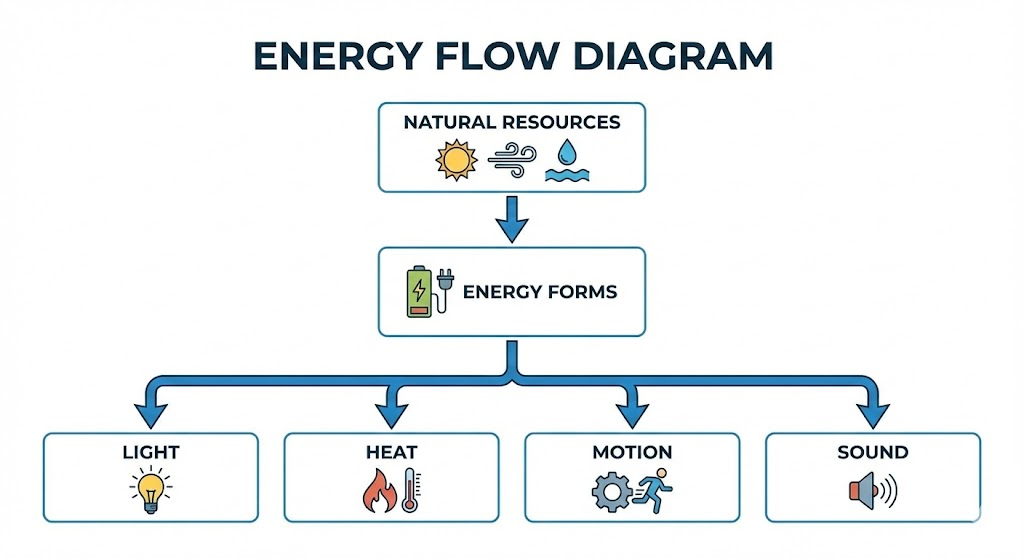
Understanding Natural Resources
Natural resources provide energy in different forms – Light, Heat, Motion, Sound. These include land, air, water, minerals, and fossil fuels.
Activity Solutions:
Objects that burn fuel:
- Car
- Airplane
- Hot air balloon
Objects needing people power:
- Bicycle
- Kayak
- Baby stroller
Objects providing light energy:
- Light bulb
- Flashlight/Torch
- Candle
- Sun
What is Sustainability?
Sustainability means maintaining the world we live in. The word comes from “Sustain” – to maintain, support, withstand, or endure.
The Jam Sandwich Example:
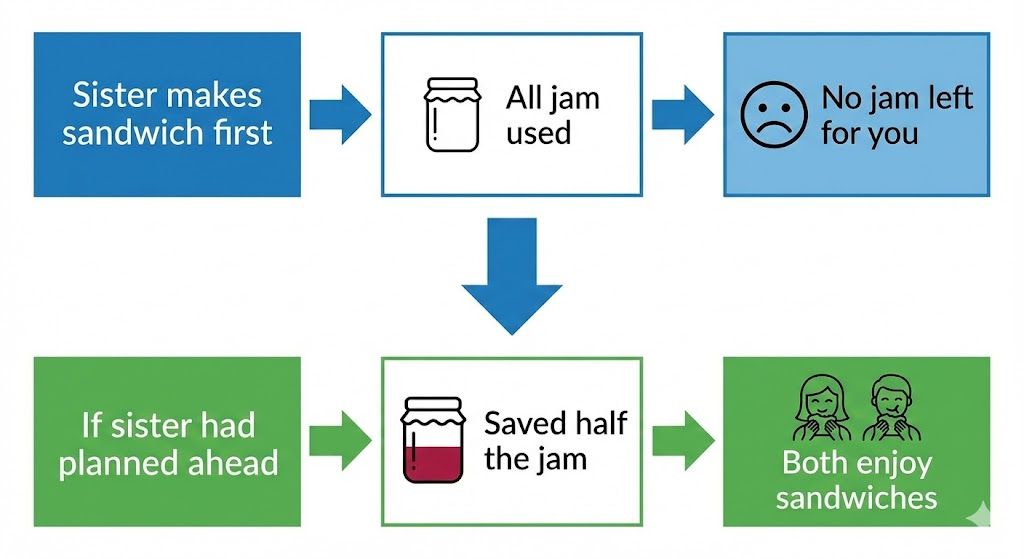
This illustrates resource management for future needs. Earth has limited resources. If we use all resources or pollute them, future generations cannot use them.
Core Principle: We must act responsibly so natural resources can support future generations.
Sustainability and Society
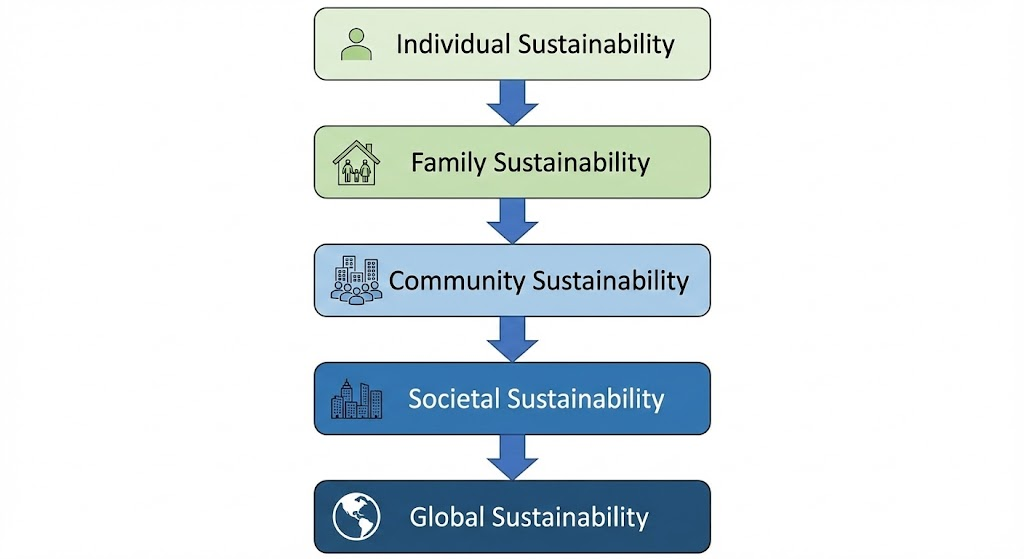
Everyone in society must follow sustainability practices. If some segments aren’t sustainable, we cannot achieve full sustainability.
Activity: Brainstorming Solutions
Q1: Do you think you live a sustainable life?
- Evaluate water usage
- Check electricity consumption
- Assess waste generation
- Consider transportation choices
Q2: How can you become more sustainable?
- Reduce plastic usage
- Save electricity
- Use public transport
- Recycle and reuse materials
- Plant trees
Q3: Which natural resources are threatened?
- Clean water supplies
- Fresh air quality
- Forest cover
- Fossil fuels
- Biodiversity
Sustainable Development Goals (SDGs)
Countries created 17 goals established by United Nations in 2015 to achieve global sustainability. Target year: 2030.
The 17 SDGs:
1. No Poverty           10. Reduced Inequalities
2. Zero Hunger          11. Sustainable Cities
3. Good Health          12. Responsible Consumption
4. Quality Education    13. Climate Action
5. Gender Equality      14. Life Below Water
6. Clean Water          15. Life on Land
7. Affordable Energy    16. Peace and Justice
8. Decent Work          17. Partnerships for Goals
9. Industry Innovation
Purpose: Address global challenges including poverty, inequality, climate change, environmental degradation, peace, and justice.
Responsibility: Shared among governments, private sector, civil society, and individuals.
Individual Contributions:
- Raise awareness
- Adopt sustainable lifestyles
- Volunteer
- Advocate policy changes
- Support organizations
SDG Wedding Cake Concept
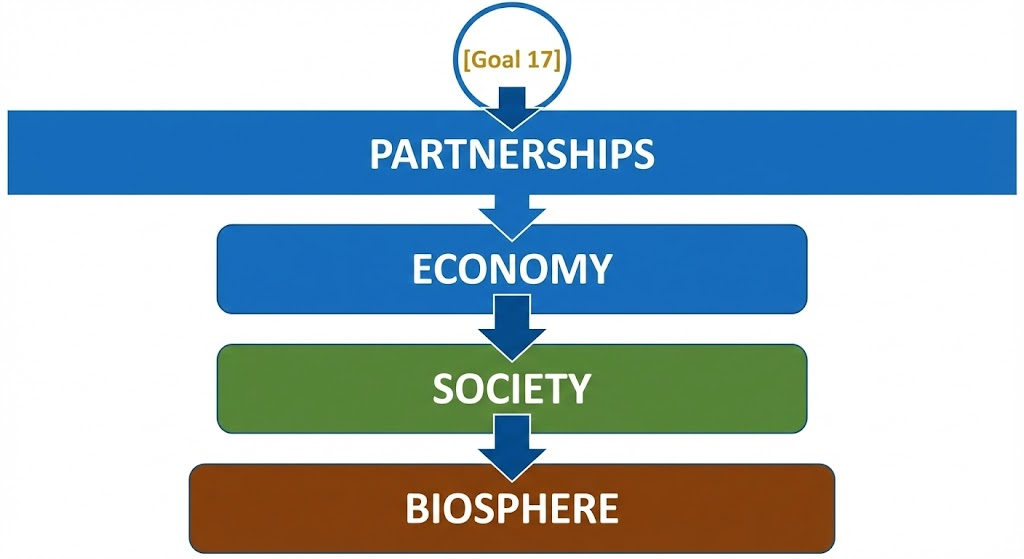
Three Categories:
- Economy: Production, consumption of goods and services
- Society: Groups of people living together
- Biosphere: Parts of Earth where life exists
Core Statement: “The economy must serve the society within the resources provided by our Earth (Biosphere)”
Activity: Global Goals Quiz Solutions
- How many SDGs adopted in 2015? d) 17
- SDG to end poverty? a) SDG 1
- SDG for healthy lives? b) SDG 3
- SDG for quality education? a) SDG 4
- Target year for SDGs? a) 2030
- SDG for sustainable cities? c) SDG 11
- SDG for climate action? d) SDG 13
- SDG for gender equality? b) SDG 5
- SDG for economic growth? c) SDG 8
Session 3: Systems Thinking and System Maps
Activity: Case Study Investigation – Borneo
Problem: Large outbreak of Malaria in Borneo (1950s)
Solution Attempted: WHO sent pesticides (DDT) to control malaria
Unexpected Consequences:
- Outbreak of Plague
- Roofs of huts breaking down
What Happened:
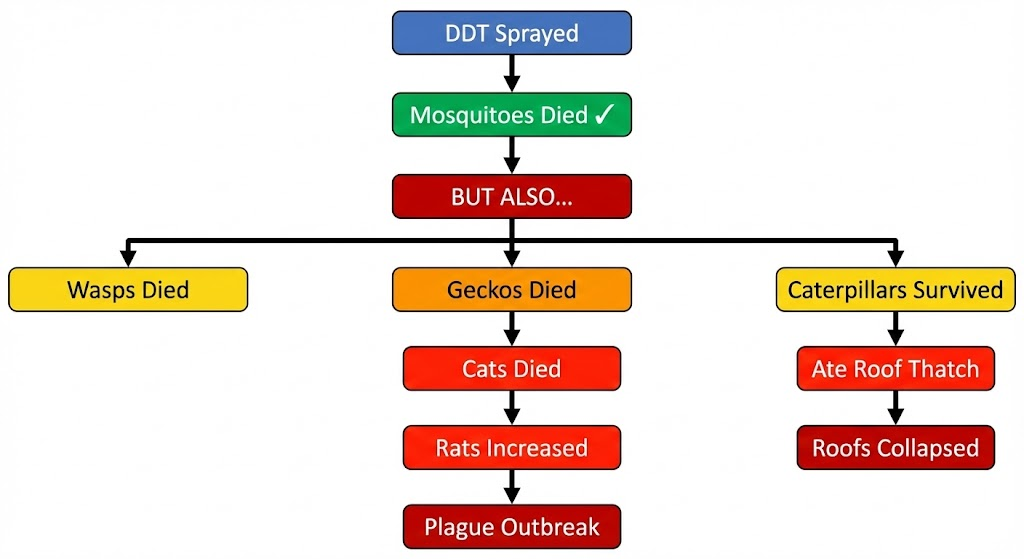
Lesson: Straightforward solutions can lead to unintended consequences.
What is Systems Thinking?
Systems thinking is a holistic approach to understanding complex problems. Rather than focusing on individual parts, it considers how various elements interact within a larger system.
Imp Features:
- System: Group of interconnected things
- Systems behave differently from individual components
- Interconnectedness: Components interact and affect each other
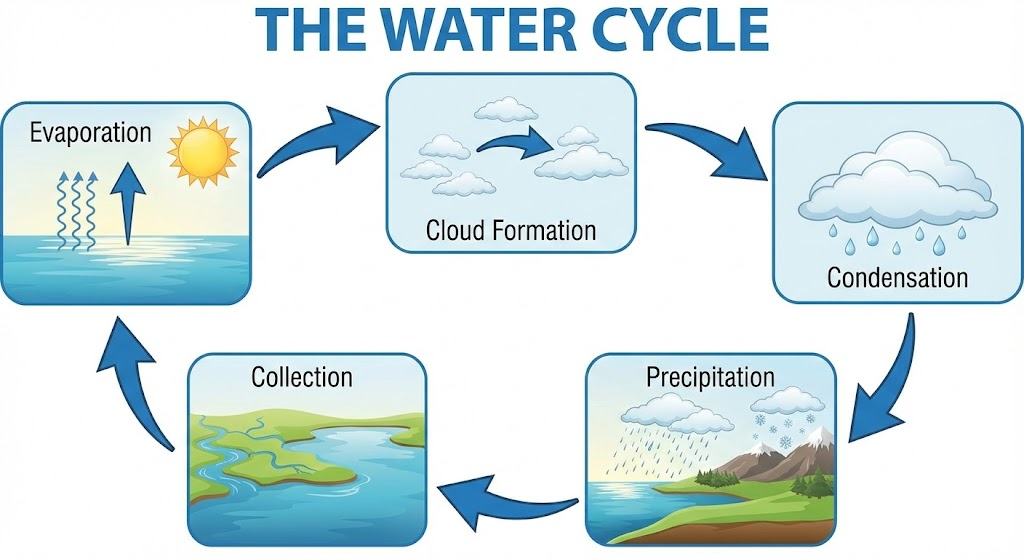
- Examples: Water Cycle, School, Digestive System, Food chains
Basics of System Maps
System Maps represent relationships visually when multiple factors affect an issue.
Elements: Factors in the system
Relationships: Connections between elements
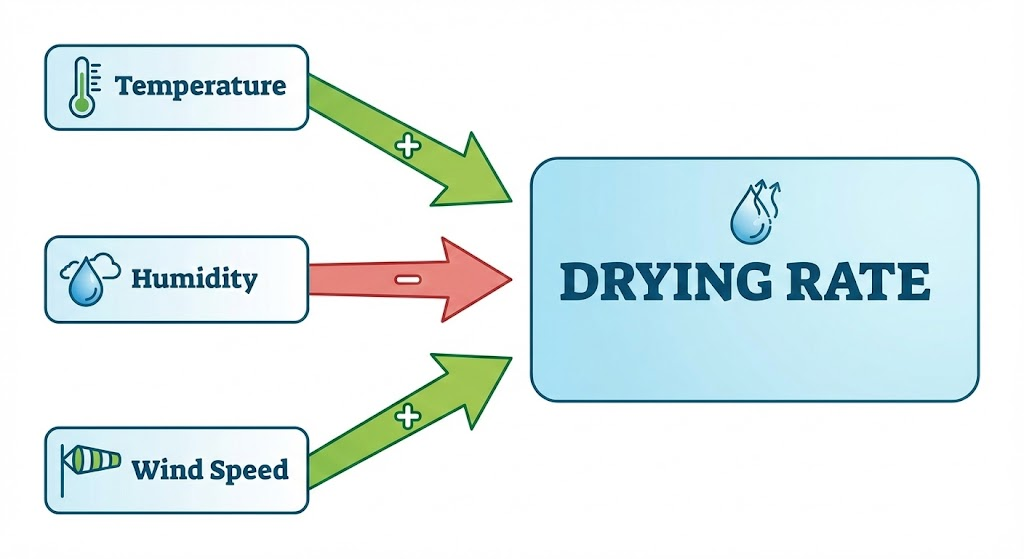
Positive Relationship (+): Increase in X leads to increase in Y
text X ───── + ─────→ Y
Negative Relationship (-): Increase in X leads to decrease in Y
text X ──── - ─────→ Y
Time Delay: Longer arrows represent longer time for change
text   X  ───── + ──────────────→  Y
      (longer arrow = more time)
Feedback Loops: Chains of causes and effects within the system
Activity: Turn ‘n’ Design Solutions
Purpose: Create system maps and understand leverage
Visit: ncase.me/loopy/v1.1/
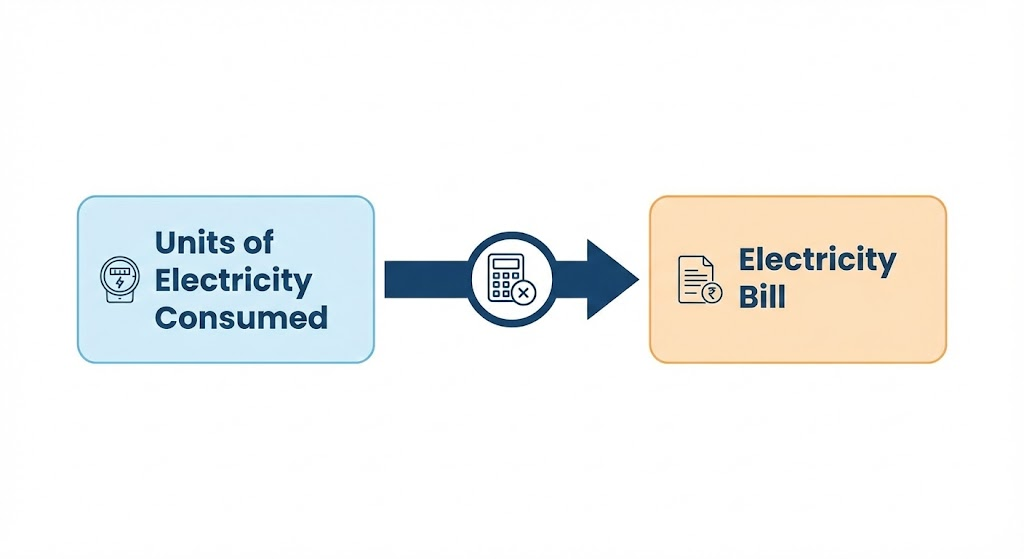
Problem 1: Electricity Bill
Problem 2: Drying Wet Clothes
Problem 3: Water Cycle
Using AI as Leverage in Systems Maps
Leverage: Best opportunity to affect change in a system. Depends on skills and ability to influence.
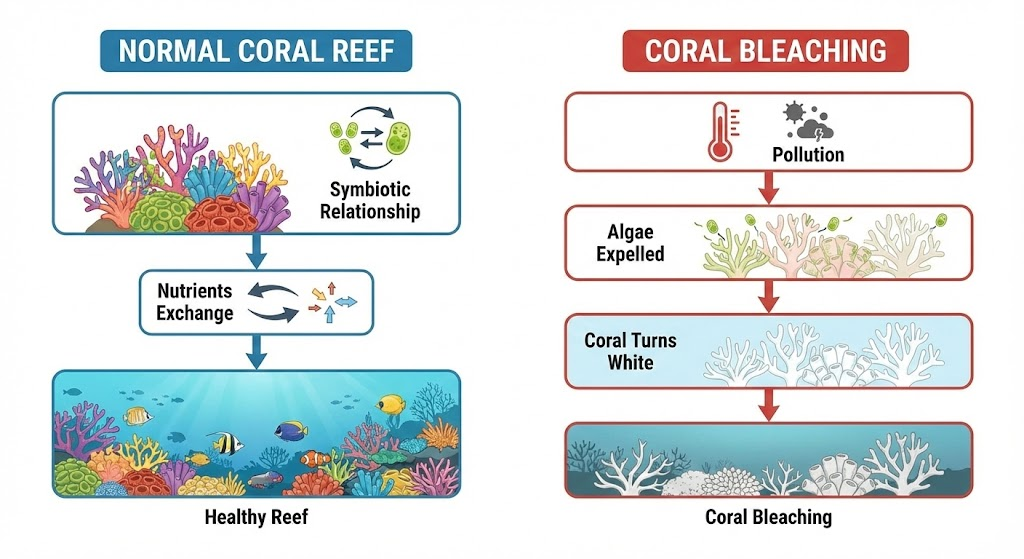
Case Study: Coral Bleaching
What are Corals?
- Tiny invertebrate animals
- Secrete Calcium Carbonate
- Form coral reefs (skeletal structures)
- Home to 25% of marine creatures (despite covering less than 1% ocean floor)
What is Coral Bleaching?
Activity: Coral Bleaching Solutions
Purpose: Understand leverage and AI usage in System Maps
Step 1: NASA Climate Kids Activity
Visit: climatekids.nasa.gov/coral-bleaching/
Observations:
- Press + to increase water temperature
- Press – to decrease pollution levels
- Click “Start Storm” to see storm effects
- Notice coral reef color changes
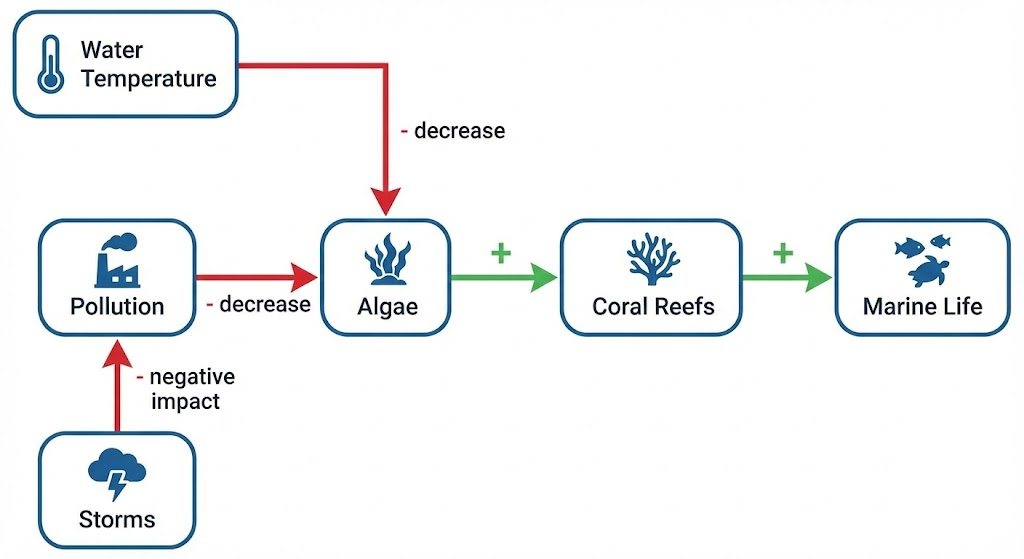
Step 2: Draw Systems Map
Visit: ncase.me/loopy/
Elements to Include:
- Coral Reefs
- Algae
- Pollution
- Water Temperature
- Storms
- Marine Life
Complete Systems Map:
How AI Can Help as Leverage:
AI can help authorities by:
- Predicting temperature changes using historical data
- Monitoring pollution levels in real-time
- Early warning systems for coral bleaching events
- Analyzing patterns to identify at-risk coral reefs
- Recommending intervention timing and methods
AI Applications:
- Statistical Data analysis of water conditions
- Computer Vision to monitor reef health
- NLP to process research reports and recommendations
Quiz: System Maps Solutions
- What is a system map?
- Answer: a) A graphical representation of components and their interactions within a system
- Primary purpose of system map?
- Answer: b) To illustrate the flow of energy and materials within a system
- Elements typically included?
- Answer: b) Feedback loops
- What does feedback loop represent?
- Answer: b) A recurring pattern of cause and effect within the system
- Benefit in problem-solving?
- Answer: b) It helps in identifying interconnected factors contributing to the issue
- Key characteristic distinguishing system maps?
- Answer: b) It focuses on illustrating relationships between elements rather than sequential order
Activity: Climate Change Impact Filter
Purpose: Experience how data changes real-life scenarios
Visit: experiments.withgoogle.com/climate-impact-filter
How It Works:
- Machine learning model trained on Google Search images
- Clustered by species types
- 62 different animal species visualized
- Shows impact at rising temperature levels
Steps:
- Launch the experiment
- Choose insect/bird/mammal/marine category
- Adjust temperature using vertical scroll bar
- Observe species survival predictions
Example Results:
Penguin (Temperature rise +1.5°C):
- 3% of Adelie Penguin species will disappear
- Based on Antarctic climate trends
- Population decline associated with warming
Oyster (Temperature rise +5°C):
- 100% of Oyster species will disappear
- Marine populations declined 1970-2012
- Critical as human food source
Learning Outcomes:
- Explore how temperature affects biodiversity
- Interpret machine-learning visualizations
- Understand climate data impact on species
Statistical Data Projects Linked to SDG
Project 1: AI for Life Forms
Purpose: Visualize SDG-related data
Data Sources: worldstat.info (statistics on global development)
Topics to Choose:
- Birth rate
- Death rate
- Infant mortality
- Life expectancy
- Food production
- CO2 emissions
Steps:
- Select topic related to SDG goal
- Download relevant data
- Use data visualization tool
- Create visual representation
- Analyze progress toward SDG goal
Project 2: AI for Human Services
Purpose: Visualize SDG-related data
Data Sources: statista.com (market data and statistics)
Topics to Choose:
- Digital users
- Social media revenue
- Internet penetration
- Technology access
Steps:
- Choose relevant topic
- Download data
- Create visual representation
- Analyze connection to SDG goals
Learning Outcomes:
- Connect real-world data with SDGs
- Learn visual representation using tools
- Identify patterns and trends in data
Download Free Mind Map from the link below
This mind map contains all important topics of this chapter